
Portfolio
The portfolio is the heart of an innovation management system built on Business Design. This is where you document and evaluate ideas, and launch new projects. Learn in this chapter what portfolios look like and how to use them.

Karl Rabes
Business Design Coach
1. Overview
The most important tool to manage your risk appetite is the idea portfolio. An idea portfolio is a visual representation of all your ideas and their relative opportunity-to-risk ratio. Ideas appear as circles of different sizes on a 2- or 3-axis coordinate system. The graphic below shows a sample portfolio.
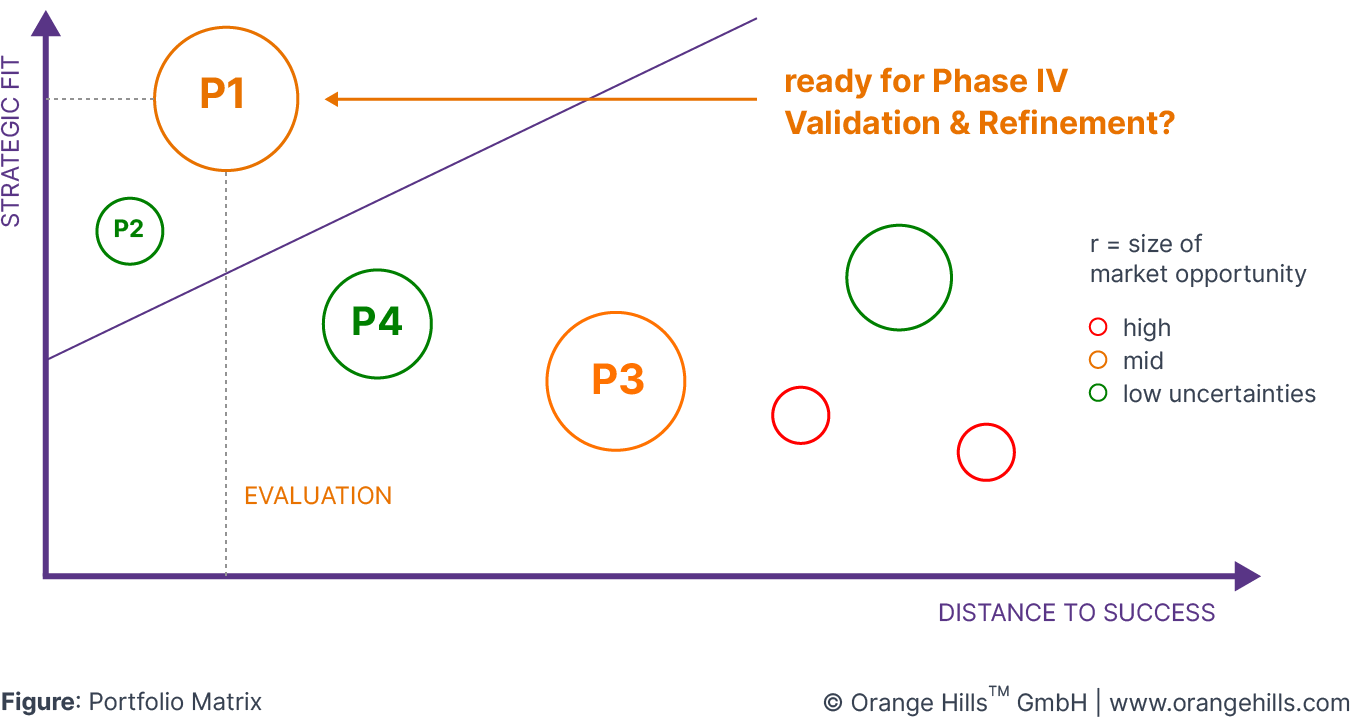
Ideas are placed on the matrix and visualised according to evaluation criteria. Ideas are evaluated relative to each other in regular meetings.
The tool looks quite simple at first glance. And yes, it is. However, the practical use and implications of the procedure around the tool are a big stretch for many organisations, and especially for C-Level Managers. Why? Some people think they lose power if they can't decide on their own what happens in the company. Others perceive an idea portfolio as a personal risk that brings too much transparency into the organisation. Just keep that in mind when you start introducing idea portfolios in your organisation.
2. Key Elements
The following evaluation criteria have proven themselves:
X-axis: Distance to success. This axis rates how far an idea is from success — covering both the effort in time and resources and the level of risk involved in bringing the idea to life. Ideas are rated relative to each other on this criterion.
Y-axis: Strategic fit. This axis rates how relevant an idea is for realising the Picture of the Future from Phase I. Here we assess the entrepreneurial opportunity — but not yet from a financial angle, since some ideas simply create the conditions needed to generate revenue or cut costs later on. Without this distinction, such ideas would get deprioritised immediately. Ideas are rated relative to each other on this criterion.
Further evaluation criteria include:
Circle size: The size of the market opportunity from a financial perspective can be shown through different circle sizes — for example, cumulative new revenue within a defined time period, or cumulative cost savings.
Circle colour: The colour of the circle shows the degree of uncertainty. Green marks low uncertainty, orange marks medium uncertainty, and red marks high uncertainty. This criterion usually correlates with the X-axis of the coordinate system.
Tag "Type of innovation": Sometimes it makes sense to describe ideas by their outcome type. We distinguish between service, product, process and Business Model innovation.
Tag "Innovation horizon": Less an evaluation criterion than a property, the innovation horizon describes an idea's nature. We distinguish between incremental innovation (H1), new business potential (H2) connected to the core business, and "game changers" (H3) — disruptive by nature, with little connection to the core business.
Depending on your industry and the actual purpose of your innovation system, further evaluation criteria and properties are of course conceivable.
We define the three innovation horizons as follows:
Incremental innovation (H1): Revision or extension of an existing product, service, software or Business Model for the same target group. Can be new features of products or services (for current customers) or process improvements ranging from strengthening the brand perception, sales support or even efficiency gains.
New business potential (H2): New product, service, software or business model with no logical predecessor within an organisation, serving today's and/or new customers from the same position in the value chain. Here, we usually deal with significant uncertainties at the edge of the comfort zone.
Game changer (H3): New product, service, software or business model with no logical predecessor within the organisation, serving new customers from a different position in the value chain. Ideas here have the potential to disrupt today's businesses or create totally new markets. Complexity, ambiguity and uncertainties are our key enemies but the upside potential is just huge.
Keep in mind
Do you know our Innovation Monitor? It's is a web-based tool that allows you to manage your portfolio online (and way more).
3. Usage Scenarios
Evaluating ideas to plan the next steps
Translating the risk appetite of the organisation into practice
Managing the workload of the organisation around innovation activities